

Nu runt Earth Hour har det pratats en del om den globala uppvärmningen och jag har märkt att det finns många åsikter men lite fakta här på forumet. Så i ett försök att samla fakta i en och samma tråd skapas nu den här.
Tråden är på engelska (för att källor är på engelska och jag hatar språkbyten) och jag räknar inte med om att någon kommer vilja/orka läsa igenom allt i ett svep. Den är mer tänkt som ett sätt att hitta information när man behöver det.
Jag ska försöka hålla mig så neutral som möjligt och ta med så många argument jag bara kan från den förnekande sidan och för att hålla så många känslor som möjligt utanför kommer jag mest citera källorna. Och källor kommer finnas längst ner.
Den här tråden kommer jag uppdatera med fler argument när jag orkar och jag ser gärna att folk ställer frågor som kan komma att besvaras och läggas in i detta inlägg.
Och orkar man inte läsa allt så förkortar jag ner det till: Du har troligast fel om du förnekar den globala uppvärmningen, att människor ligger bakom den eller att faran är överdriven.
Vi kan börja med att dela in argumenten och påståendena i olika kategorier.
- Det händer inte!
- Det är inte vårt fel!
- Det är inte så illa!
- Det är så jobbigt!
1.0 Det händer inte
1.1 Temperaturmätningarna är inte tillförlitliga!
Visa spoiler
- "U.S. weather stations have been located next to exhaust fans of air conditioning units, surrounded by asphalt parking lots, on blistering-hot rooftops, and near sidewalks and buildings that absorb and radiate heat. 89 percent of the stations fail to meet the National Weather Service’s own siting requirements that stations must be 30 metres away from an artificial heating or radiating/reflecting heat source. (Watts 2009)"
Vad fakta pekar på:
"The goal of improving temperature data is something we can all agree on and on this point, the efforts of Anthony Watts and Steve McIntyre are laudable. However, their presupposition that improving temperature records will remove or significantly lower the global warming trend is erroneous.
Adjusting for urban heat island effect
When compiling temperature records, NASA's GISS goes to great pains to remove any possible influence from urban heat island effect. They compare urban long-term trends to nearby rural trends. They then adjust the urban trend so it matches the rural trend. The process is described in detail on the NASA website (Hansen 2001).
They found in most cases, urban warming was small and fell within uncertainty ranges. Surprisingly, 42% of city trends are cooler relative to their country surroundings as weather stations are often sited in cool islands (a park within the city). The point is they're aware of UHI and rigorously adjust for it when analyzing temperature records. More on urban heat island...
Climate Audit and NASA's "Y2K" glitch
Steve McIntyre's discovery of a glitch in the GISS temperature data is an impressive achievement. Make no mistake, it's an embarrassing error on the part of NASA. But what is the significance?
Figure 1 compares the global temperature trend from before and after adjustments. Before the error was discovered, the trend was 0.185°C/decade. After corrections were made, the trend was still 0.185°C/decade. The change to the global mean was less than one thousandth of a degree. More on NASA's Y2K glitch...

Figure 1: Global temperature anomaly before (red squares) and after (black diamonds) NASA's "Y2K" corrections (Open Mind).
There are three prominent reconstructions of monthly global mean surface temperature (GMST) from instrumental data (fig. 1): NASA's GISTEMP analysis, the CRUTEM analysis (from the University of East Anglia's Climatic Research Unit), and an analysis by NOAA's National Climatic Data Center (NCDC).
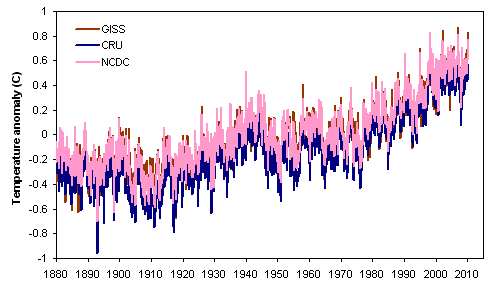
Figure 1. Comparison of global (land & ocean) mean surface temperature reconstructions from NASA GISS, the University of East Anglia's CRU, and NOAA NCDC.
How reliable are these temperature reconstructions?
Various questions have been raised about both the data and the methods used to produce them. Now, thanks to the hard work of many people, we can conclude that the three global temperature analyses are reasonable, and the true surface temperature trend is unlikely to be substantially different from the picture drawn by NASA, CRU, and NOAA.
The three GMST analyses have much in common, though there are significant differences among them as well. All three have at their core the monthly temperature data from the Global Historical Climatology Network (GHCN), and all three produce both a land-stations-only reconstruction and a combined land/ocean reconstruction that includes sea surface temperature measurements.
Let's explore the reliability of these reconstructions, from several different angles.
The data and software used to produce these reconstructions are publicly available
Source code and data to recreate GISTEMP and CRUTEM are available from NASA and CRU websites. (The data set provided by CRU excludes a fraction of the data that were obtained from third parties, but the results are not substantially affected by this).
The software has been successfully tested outside of NASA and CRU, and it works as advertised
Both GISTEMP and CRUTEM have been successfully implemented by independent investigators. For example, Ron Broberg has run both the CRUTEM and GISTEMP code. In addition, the Clear Climate Code project has duplicated GISTEMP in Python. Figure 2 shows a comparison of the output of the GISTEMP reconstruction process as implemented by NASA and by Clear Climate Code ... but since the results are identical, the second line falls exactly on top of the first.
[img] http://clearclimatecode.org/all-python-ccc-gistemp-release/[/img]
Figure 2. The GISTEMP land/ocean temperature analysis as implemented by NASA and by Clear Climate Code. Results of the two analyses are effectively identical.
Similar results can be obtained using different software and methods!
Over the past year, there has been quite a flurry of "do-it-yourself" temperature reconstructions by independent analysts, using either land-only or combined land-ocean data. In addition to the previously-mentioned work by Ron Broberg and Clear Climate Code, these include the following:
* Nick Stokes
* Zeke Hausfather
* Joseph at Residual Analysis
* Chad Herman
* JeffId and RomanM
* Tamino
(There are probably others as well that we're omitting!)
Most recently, the Muir Russell investigation in the UK was able to write their own software for global temperature analysis in a couple of days.
For all of these cases, the results are generally quite close to the "official" results from NASA GISS, CRU, and NOAA NCDC. Figure 3 shows a collection of seven land-only reconstructions, and Figure 4 shows five global (land-ocean) reconstructions.
 "
"
Figure 3. Comparison of land-only reconstructions, 1900-2009. Note that the NASA GISS reconstruction using only land stations is not shown here, because it is conceptually different from the other analyses.

Figure 4. Comparison of land-ocean reconstructions, 1900-2009.
Obviously, the results of the reconstructions are quite similar, whether they're by the "Big Three" or by independent analysts.
The temperature increase is not an artifact of the GHCN adjustment process!
Most of the analyses shown above actually use the raw (unadjusted) GHCN data. Zeke Hausfather has done comparisons using both the adjusted and raw versions of the GHCN data set, and as shown in fig. 5, the results are not substantially different at the global scale (though 2008 is a bit of an outlier).

Figure 5. Comparison of global temperatures from raw and adjusted GHCN data, 1900-2009 (analysis by Zeke Hausfather).
The temperature increase is not an artifact of declining numbers of stations!
While it is true that the number of stations in GHCN has decreased since the early 1990s, that has no real effect on the results of spatially weighted global temperature reconstructions. How do we know this?
* Comparisons of trends for stations that dropped out versus stations that persisted post-1990 show no difference in the two populations prior to the dropouts (see, e.g., here and here and here).
* The spatial weighting processes (e.g., gridding) used in these analyses makes them robust to the loss of stations. In fact, Nick Stokes has shown that it's possible to derive a global temperature reconstruction using just 61 stations worldwide (in this case, all the stations from GISTEMP that are classified as rural, have at least 90 years of data, and have data in 2010).
* Other data sets that don't suffer from GHCN's decline in station numbers show the same temperature increase (see below).
One prominent claim (by Joe D'Aleo and Anthony Watts) was that the loss of "cool" stations (at high altitudes, high latitudes, and rural areas) created a warming bias in the temperature trends. But Ron Broberg conclusively disproved this, by comparing trends after removing the categories of stations in question. D'Aleo and Watts are simply wrong.
The temperature increase is not an artifact of stations being located at airports
This might seem like an odd statement, but some people have suggested that the tendency for weather stations to be located at airports has artificially inflated the temperature trend. Fortunately, there is not much difference in the temperature trend between airport and non-airport stations.
The temperature increase is present in other data sets, not just GHCN
All of the above studies rely (mostly or entirely) on monthly station data from the GHCN database. But it turns out that other, independent data sets give very similar results.

Figure 6. Comparison of global temperatures from the Global Historical Climatology Network (GHCN) and Global Summary of the Day (GSOD) databases. (Analysis by Ron Broberg and Nick Stokes).
What about satellite measurements of temperatures in the lower troposphere? There are two widely cited analyses of temperature trends from the MSU sensor on NOAA's polar orbiting earth observation satellites, one from Remote Sensing Systems (RSS) and one from the University of Alabama-Huntsville (UAH). These data only go back to 1979, but they do provide a good comparison to the surface temperature data over the past three decades. Figure 7 shows a comparison of land, ocean, and global temperature data from the surface reconstructions (averaging the multiple analyses shown in figs. 3 and 4) and from satellites (averaging the results from RSS and UAH):

Figure 7. Comparison of temperatures from surface stations and satellite monitoring of the lower troposphere.
We'll end by looking at all the surface and satellite-based temperature trends over the entire period for which both are available (1979-present). What are the trends in the various data sets and regions? As shown in fig. 8, the surface temperature trends over land have a fair amount of variability, but all lie between +0.2 and +0.3 C/decade. Surface trends that include the oceans are more uniform.

Figure 8. Comparison of temperature trends, in degrees C per decade.
Overall, the satellite measurements show lower trends than surface measurements. This is a bit of a puzzle, because climate models suggest that overall the lower troposphere should be warming about 1.2X faster than the surface (though over land there should be little difference, or the surface should be warming faster). Thus, there are at least three possibilities:
* The surface temperature trends show slightly too much warming.
* The satellite temperature trends show slightly too little warming.
* The prediction of climate models (about amplified warming in the lower troposphere) is incorrect, or there are complicating factors that are being missed.
It should be noted that in the past the discrepancy between surface and satellite temperature trends was much larger. Correcting various errors in the processing of the satellite data has brought them into much closer agreement with the surface data.
Conclusions
The well-known and widely-cited reconstructions of global temperature, produced by NASA GISS, UEA CRU, and NOAA NCDC, are replicable.
Independent studies using different software, different methods, and different data sets yield very similar results.
The increase in temperatures since 1975 is a consistent feature of all reconstructions. This increase cannot be explained as an artifact of the adjustment process, the decrease in station numbers, or other non-climatological factors.
Vad fakta pekar på:
"The goal of improving temperature data is something we can all agree on and on this point, the efforts of Anthony Watts and Steve McIntyre are laudable. However, their presupposition that improving temperature records will remove or significantly lower the global warming trend is erroneous.
Adjusting for urban heat island effect
When compiling temperature records, NASA's GISS goes to great pains to remove any possible influence from urban heat island effect. They compare urban long-term trends to nearby rural trends. They then adjust the urban trend so it matches the rural trend. The process is described in detail on the NASA website (Hansen 2001).
They found in most cases, urban warming was small and fell within uncertainty ranges. Surprisingly, 42% of city trends are cooler relative to their country surroundings as weather stations are often sited in cool islands (a park within the city). The point is they're aware of UHI and rigorously adjust for it when analyzing temperature records. More on urban heat island...
Climate Audit and NASA's "Y2K" glitch
Steve McIntyre's discovery of a glitch in the GISS temperature data is an impressive achievement. Make no mistake, it's an embarrassing error on the part of NASA. But what is the significance?
Figure 1 compares the global temperature trend from before and after adjustments. Before the error was discovered, the trend was 0.185°C/decade. After corrections were made, the trend was still 0.185°C/decade. The change to the global mean was less than one thousandth of a degree. More on NASA's Y2K glitch...
Figure 1: Global temperature anomaly before (red squares) and after (black diamonds) NASA's "Y2K" corrections (Open Mind).
There are three prominent reconstructions of monthly global mean surface temperature (GMST) from instrumental data (fig. 1): NASA's GISTEMP analysis, the CRUTEM analysis (from the University of East Anglia's Climatic Research Unit), and an analysis by NOAA's National Climatic Data Center (NCDC).
Figure 1. Comparison of global (land & ocean) mean surface temperature reconstructions from NASA GISS, the University of East Anglia's CRU, and NOAA NCDC.
How reliable are these temperature reconstructions?
Various questions have been raised about both the data and the methods used to produce them. Now, thanks to the hard work of many people, we can conclude that the three global temperature analyses are reasonable, and the true surface temperature trend is unlikely to be substantially different from the picture drawn by NASA, CRU, and NOAA.
The three GMST analyses have much in common, though there are significant differences among them as well. All three have at their core the monthly temperature data from the Global Historical Climatology Network (GHCN), and all three produce both a land-stations-only reconstruction and a combined land/ocean reconstruction that includes sea surface temperature measurements.
Let's explore the reliability of these reconstructions, from several different angles.
The data and software used to produce these reconstructions are publicly available
Source code and data to recreate GISTEMP and CRUTEM are available from NASA and CRU websites. (The data set provided by CRU excludes a fraction of the data that were obtained from third parties, but the results are not substantially affected by this).
The software has been successfully tested outside of NASA and CRU, and it works as advertised
Both GISTEMP and CRUTEM have been successfully implemented by independent investigators. For example, Ron Broberg has run both the CRUTEM and GISTEMP code. In addition, the Clear Climate Code project has duplicated GISTEMP in Python. Figure 2 shows a comparison of the output of the GISTEMP reconstruction process as implemented by NASA and by Clear Climate Code ... but since the results are identical, the second line falls exactly on top of the first.
[img] http://clearclimatecode.org/all-python-ccc-gistemp-release/[/img]
Figure 2. The GISTEMP land/ocean temperature analysis as implemented by NASA and by Clear Climate Code. Results of the two analyses are effectively identical.
Similar results can be obtained using different software and methods!
Over the past year, there has been quite a flurry of "do-it-yourself" temperature reconstructions by independent analysts, using either land-only or combined land-ocean data. In addition to the previously-mentioned work by Ron Broberg and Clear Climate Code, these include the following:
* Nick Stokes
* Zeke Hausfather
* Joseph at Residual Analysis
* Chad Herman
* JeffId and RomanM
* Tamino
(There are probably others as well that we're omitting!)
Most recently, the Muir Russell investigation in the UK was able to write their own software for global temperature analysis in a couple of days.
For all of these cases, the results are generally quite close to the "official" results from NASA GISS, CRU, and NOAA NCDC. Figure 3 shows a collection of seven land-only reconstructions, and Figure 4 shows five global (land-ocean) reconstructions.
"Figure 3. Comparison of land-only reconstructions, 1900-2009. Note that the NASA GISS reconstruction using only land stations is not shown here, because it is conceptually different from the other analyses.
Figure 4. Comparison of land-ocean reconstructions, 1900-2009.
Obviously, the results of the reconstructions are quite similar, whether they're by the "Big Three" or by independent analysts.
The temperature increase is not an artifact of the GHCN adjustment process!
Most of the analyses shown above actually use the raw (unadjusted) GHCN data. Zeke Hausfather has done comparisons using both the adjusted and raw versions of the GHCN data set, and as shown in fig. 5, the results are not substantially different at the global scale (though 2008 is a bit of an outlier).
Figure 5. Comparison of global temperatures from raw and adjusted GHCN data, 1900-2009 (analysis by Zeke Hausfather).
The temperature increase is not an artifact of declining numbers of stations!
While it is true that the number of stations in GHCN has decreased since the early 1990s, that has no real effect on the results of spatially weighted global temperature reconstructions. How do we know this?
* Comparisons of trends for stations that dropped out versus stations that persisted post-1990 show no difference in the two populations prior to the dropouts (see, e.g., here and here and here).
* The spatial weighting processes (e.g., gridding) used in these analyses makes them robust to the loss of stations. In fact, Nick Stokes has shown that it's possible to derive a global temperature reconstruction using just 61 stations worldwide (in this case, all the stations from GISTEMP that are classified as rural, have at least 90 years of data, and have data in 2010).
* Other data sets that don't suffer from GHCN's decline in station numbers show the same temperature increase (see below).
One prominent claim (by Joe D'Aleo and Anthony Watts) was that the loss of "cool" stations (at high altitudes, high latitudes, and rural areas) created a warming bias in the temperature trends. But Ron Broberg conclusively disproved this, by comparing trends after removing the categories of stations in question. D'Aleo and Watts are simply wrong.
The temperature increase is not an artifact of stations being located at airports
This might seem like an odd statement, but some people have suggested that the tendency for weather stations to be located at airports has artificially inflated the temperature trend. Fortunately, there is not much difference in the temperature trend between airport and non-airport stations.
The temperature increase is present in other data sets, not just GHCN
All of the above studies rely (mostly or entirely) on monthly station data from the GHCN database. But it turns out that other, independent data sets give very similar results.
Figure 6. Comparison of global temperatures from the Global Historical Climatology Network (GHCN) and Global Summary of the Day (GSOD) databases. (Analysis by Ron Broberg and Nick Stokes).
What about satellite measurements of temperatures in the lower troposphere? There are two widely cited analyses of temperature trends from the MSU sensor on NOAA's polar orbiting earth observation satellites, one from Remote Sensing Systems (RSS) and one from the University of Alabama-Huntsville (UAH). These data only go back to 1979, but they do provide a good comparison to the surface temperature data over the past three decades. Figure 7 shows a comparison of land, ocean, and global temperature data from the surface reconstructions (averaging the multiple analyses shown in figs. 3 and 4) and from satellites (averaging the results from RSS and UAH):
Figure 7. Comparison of temperatures from surface stations and satellite monitoring of the lower troposphere.
We'll end by looking at all the surface and satellite-based temperature trends over the entire period for which both are available (1979-present). What are the trends in the various data sets and regions? As shown in fig. 8, the surface temperature trends over land have a fair amount of variability, but all lie between +0.2 and +0.3 C/decade. Surface trends that include the oceans are more uniform.
Figure 8. Comparison of temperature trends, in degrees C per decade.
Overall, the satellite measurements show lower trends than surface measurements. This is a bit of a puzzle, because climate models suggest that overall the lower troposphere should be warming about 1.2X faster than the surface (though over land there should be little difference, or the surface should be warming faster). Thus, there are at least three possibilities:
* The surface temperature trends show slightly too much warming.
* The satellite temperature trends show slightly too little warming.
* The prediction of climate models (about amplified warming in the lower troposphere) is incorrect, or there are complicating factors that are being missed.
It should be noted that in the past the discrepancy between surface and satellite temperature trends was much larger. Correcting various errors in the processing of the satellite data has brought them into much closer agreement with the surface data.
Conclusions
The well-known and widely-cited reconstructions of global temperature, produced by NASA GISS, UEA CRU, and NOAA NCDC, are replicable.
Independent studies using different software, different methods, and different data sets yield very similar results.
The increase in temperatures since 1975 is a consistent feature of all reconstructions. This increase cannot be explained as an artifact of the adjustment process, the decrease in station numbers, or other non-climatological factors.
1.1.1 "Hockeyklubban" är trasig!
Visa spoiler
"- In 2003 Professor McKitrick teamed with a Canadian engineer, Steve McIntyre, in attempting to replicate the hockey stick and debunked it as statistical nonsense. They revealed how the chart was derived from 'collation errors, unjustified truncation or extrapolation of source data, obsolete data, incorrect principal component calculations, geographical mislocations and other serious defects', substantially affecting the temperature index. (John McLaughlin)"
Vad fakta pekar på:
The "hockey stick" describes a reconstruction of past temperature over the past 1000 to 2000 years using tree-rings, ice cores, coral and other records that act as proxies for temperature (Mann 1999). The reconstruction found that global temperature gradually cooled over the last 1000 years with a sharp upturn in the 20th Century. The principal result from the hockey stick is that global temperatures over the last few decades are the warmest in the last 1000 years.

Figure 1: Northern Hemisphere temperature changes estimated from various proxy records shown in blue (Mann 1999). Instrumental data shown in red. Note the large uncertainty (grey area) as you go further back in time.
A critique of the hockey stick was published in 2004 (McIntyre 2004), claiming the hockey stick shape was the inevitable result of the statistical method used (principal components analysis). They also claimed temperatures over the 15th Century were derived from one bristlecone pine proxy record. They concluded that the hockey stick shape was not statistically significant.
An independent assessment of Mann's hockey stick was conducted by the National Center for Atmospheric Research (Wahl 2007). They reconstructed temperatures employing a variety of statistical techniques (with and without principal components analysis). Their results found slightly different temperatures in the early 15th Century. However, they confirmed the principal results of the original hockey stick - that the warming trend and temperatures over the last few decades are unprecedented over at least the last 600 years.

Figure 2: Original hockey stick graph (blue - MBH1998) compared to Wahl & Ammann reconstruction (red). Instrumental record in black (Wahl 2007).
While many continue to fixate on Mann's early work on proxy records, the science of paleoclimatology has moved on. Since 1999, there have been many independent reconstructions of past temperatures, using a variety of proxy data and a number of different methodologies. All find the same result - that the last few decades are the hottest in the last 500 to 2000 years (depending on how far back the reconstruction goes). What are some of the proxies that are used to determine past temperature?
Changes in surface temperature send thermal waves underground, cooling or warming the subterranean rock. To track these changes, underground temperature measurements were examined from over 350 bore holes in North America, Europe, Southern Africa and Australia (Huang 2000). Borehole reconstructions aren't able to give short term variation, yielding only century-scale trends. What they find is that the 20th century is the warmest of the past five centuries with the strongest warming trend in 500 years.

Figure 3: Global surface temperature change over the last five centuries from boreholes (thick red line). Shading represents uncertainty. Blue line is a five year running average of HadCRUT global surface air temperature (Huang 2000).
Stalagmites (or speleothems) are formed from groundwater within underground caverns. As they're annually banded, the thickness of the layers can be used as climate proxies. A reconstruction of Northern Hemisphere temperature from stalagmites shows that while the uncertainty range (grey area) is significant, the temperature in the latter 20th Century exceeds the maximum estimate over the past 500 years (Smith 2006).

Figure 4: Northern Hemisphere annual temperature reconstruction from speleothem reconstructions shown with 2 standard error (shaded area) (Smith 2006).
Historical records of glacier length can be used as a proxy for temperature. As the number of monitored glaciers diminishes in the past, the uncertainty grows accordingly. Nevertheless, temperatures in recent decades exceed the uncertainty range over the past 400 years (Oerlemans 2005).

Figure 5: Global mean temperature calculated form glaciers. The red vertical lines indicate uncertainty.
Of course, these examples only go back around 500 years - this doesn't even cover the Medieval Warm Period. When you combine all the various proxies, including ice cores, coral, lake sediments, glaciers, boreholes & stalagmites, it's possible to reconstruct Northern Hemisphere temperatures without tree-ring proxies going back 1,300 years (Mann 2008). The result is that temperatures in recent decades exceed the maximum proxy estimate (including uncertainty range) for the past 1,300 years. When you include tree-ring data, the same result holds for the past 1,700 years.

Figure 6: Composite Northern Hemisphere land and land plus ocean temperature reconstructions and estimated 95% confidence intervals. Shown for comparison are published Northern Hemisphere reconstructions (Mann 2008).
Paleoclimatology draws upon a range of proxies and methodologies to calculate past temperatures. This allows independent confirmation of the basic hockey stick result: that the past few decades are the hottest in the past 1,300 years.
Vad fakta pekar på:
The "hockey stick" describes a reconstruction of past temperature over the past 1000 to 2000 years using tree-rings, ice cores, coral and other records that act as proxies for temperature (Mann 1999). The reconstruction found that global temperature gradually cooled over the last 1000 years with a sharp upturn in the 20th Century. The principal result from the hockey stick is that global temperatures over the last few decades are the warmest in the last 1000 years.
Figure 1: Northern Hemisphere temperature changes estimated from various proxy records shown in blue (Mann 1999). Instrumental data shown in red. Note the large uncertainty (grey area) as you go further back in time.
A critique of the hockey stick was published in 2004 (McIntyre 2004), claiming the hockey stick shape was the inevitable result of the statistical method used (principal components analysis). They also claimed temperatures over the 15th Century were derived from one bristlecone pine proxy record. They concluded that the hockey stick shape was not statistically significant.
An independent assessment of Mann's hockey stick was conducted by the National Center for Atmospheric Research (Wahl 2007). They reconstructed temperatures employing a variety of statistical techniques (with and without principal components analysis). Their results found slightly different temperatures in the early 15th Century. However, they confirmed the principal results of the original hockey stick - that the warming trend and temperatures over the last few decades are unprecedented over at least the last 600 years.
Figure 2: Original hockey stick graph (blue - MBH1998) compared to Wahl & Ammann reconstruction (red). Instrumental record in black (Wahl 2007).
While many continue to fixate on Mann's early work on proxy records, the science of paleoclimatology has moved on. Since 1999, there have been many independent reconstructions of past temperatures, using a variety of proxy data and a number of different methodologies. All find the same result - that the last few decades are the hottest in the last 500 to 2000 years (depending on how far back the reconstruction goes). What are some of the proxies that are used to determine past temperature?
Changes in surface temperature send thermal waves underground, cooling or warming the subterranean rock. To track these changes, underground temperature measurements were examined from over 350 bore holes in North America, Europe, Southern Africa and Australia (Huang 2000). Borehole reconstructions aren't able to give short term variation, yielding only century-scale trends. What they find is that the 20th century is the warmest of the past five centuries with the strongest warming trend in 500 years.
Figure 3: Global surface temperature change over the last five centuries from boreholes (thick red line). Shading represents uncertainty. Blue line is a five year running average of HadCRUT global surface air temperature (Huang 2000).
Stalagmites (or speleothems) are formed from groundwater within underground caverns. As they're annually banded, the thickness of the layers can be used as climate proxies. A reconstruction of Northern Hemisphere temperature from stalagmites shows that while the uncertainty range (grey area) is significant, the temperature in the latter 20th Century exceeds the maximum estimate over the past 500 years (Smith 2006).
Figure 4: Northern Hemisphere annual temperature reconstruction from speleothem reconstructions shown with 2 standard error (shaded area) (Smith 2006).
Historical records of glacier length can be used as a proxy for temperature. As the number of monitored glaciers diminishes in the past, the uncertainty grows accordingly. Nevertheless, temperatures in recent decades exceed the uncertainty range over the past 400 years (Oerlemans 2005).
Figure 5: Global mean temperature calculated form glaciers. The red vertical lines indicate uncertainty.
Of course, these examples only go back around 500 years - this doesn't even cover the Medieval Warm Period. When you combine all the various proxies, including ice cores, coral, lake sediments, glaciers, boreholes & stalagmites, it's possible to reconstruct Northern Hemisphere temperatures without tree-ring proxies going back 1,300 years (Mann 2008). The result is that temperatures in recent decades exceed the maximum proxy estimate (including uncertainty range) for the past 1,300 years. When you include tree-ring data, the same result holds for the past 1,700 years.
Figure 6: Composite Northern Hemisphere land and land plus ocean temperature reconstructions and estimated 95% confidence intervals. Shown for comparison are published Northern Hemisphere reconstructions (Mann 2008).
Paleoclimatology draws upon a range of proxies and methodologies to calculate past temperatures. This allows independent confirmation of the basic hockey stick result: that the past few decades are the hottest in the past 1,300 years.
1.2 Det är ju askallt!
Visa spoiler
- "Austria is today seeing its earliest snowfall in history with 30 to 40 centimetres already predicted in the mountains. Such dramatic falls in temperatures provide superficial evidence for those who doubt that the world is threatened by climate change." (Mail Online)
Vad fakta pekar på:
"It's easy to confuse current weather events with long-term climate trends, and hard to understand the difference between weather and climate. It's a bit like being at the beach, trying to figure out if the tide is rising or falling just by watching individual waves roll in and out. The slow change of the tide is masked by the constant churning of the waves.
In a similar way, the normal ups and downs of weather make it hard to see slow changes in climate. To find climate trends you need to look at how weather is changing over a longer time span. Looking at high and low temperature data from recent decades shows that new record highs occur nearly twice as often as new record lows.

New records for cold weather will continue to be set, but global warming's gradual influence will make them increasingly rare."
Vad fakta pekar på:
"It's easy to confuse current weather events with long-term climate trends, and hard to understand the difference between weather and climate. It's a bit like being at the beach, trying to figure out if the tide is rising or falling just by watching individual waves roll in and out. The slow change of the tide is masked by the constant churning of the waves.
In a similar way, the normal ups and downs of weather make it hard to see slow changes in climate. To find climate trends you need to look at how weather is changing over a longer time span. Looking at high and low temperature data from recent decades shows that new record highs occur nearly twice as often as new record lows.
New records for cold weather will continue to be set, but global warming's gradual influence will make them increasingly rare."
1.3 Vi är på väg mot en ny istid!
Visa spoiler
- "One day you'll wake up buried beneath nine stories of snow. It's all part of a dependable, predictable cycle, a natural cycle that returns like clockwork every 11,500 years. And since the last ice age ended almost exactly 11,500 years ago..." (Ice Age Now)
Vad fakta pekar på:
According to ice cores from Antarctica, the past 400,000 years have been dominated by glacials, also known as ice ages, that last about 100,000. These glacials have been punctuated by interglacials, short warm periods which typically last 11,500 years. Figure 1 below shows how temperatures in Antarctica changed over this period. Because our current interglacial (the Holocene) has already lasted approximately 12,000 years, it has led some to claim that a new ice age is imminent. Is this a valid claim?

Figure 1: Temperature change at Vostok, Antarctica (Petit 2000). The timing of warmer interglacials is highlighted in green; our current interglacial, the Holocene, is the one on the far right of the graph.
To answer this question, it is necessary to understand what has caused the shifts between ice ages and interglacials during this period. The cycle appears to be a response to changes in the Earth’s orbit and tilt, which affect the amount of summer sunlight reaching the northern hemisphere. When this amount declines, the rate of summer melt declines and the ice sheets begin to grow. In turn, this increases the amount of sunlight reflected back into space, increasing (or amplifying) the cooling trend. Eventually a new ice age emerges and lasts for about 100,000 years.
So what are today’s conditions like? Changes in both the orbit and tilt of the Earth do indeed indicate that the Earth should be cooling. However, two reasons explain why an ice age is unlikely:
1. These two factors, orbit and tilt, are weak and are not acting within the same timescale – they are out of phase by about 10,000 years. This means that their combined effect would probably be too weak to trigger an ice age. You have to go back 430,000 years to find an interglacial with similar conditions, and this interglacial lasted about 30,000 years.
2. The warming effect from CO2 and other greenhouse gases is greater than the cooling effect expected from natural factors. Without human interference, the Earth’s orbit and tilt, a slight decline in solar output since the 1950s and volcanic activity would have led to global cooling. Yet global temperatures are definitely on the rise.
It can therefore be concluded that with CO2 concentrations set to continue to rise, a return to ice age conditions seems very unlikely. Instead, temperatures are increasing and this increase may come at a considerable cost with few or no benefits.
Vad fakta pekar på:
According to ice cores from Antarctica, the past 400,000 years have been dominated by glacials, also known as ice ages, that last about 100,000. These glacials have been punctuated by interglacials, short warm periods which typically last 11,500 years. Figure 1 below shows how temperatures in Antarctica changed over this period. Because our current interglacial (the Holocene) has already lasted approximately 12,000 years, it has led some to claim that a new ice age is imminent. Is this a valid claim?
Figure 1: Temperature change at Vostok, Antarctica (Petit 2000). The timing of warmer interglacials is highlighted in green; our current interglacial, the Holocene, is the one on the far right of the graph.
To answer this question, it is necessary to understand what has caused the shifts between ice ages and interglacials during this period. The cycle appears to be a response to changes in the Earth’s orbit and tilt, which affect the amount of summer sunlight reaching the northern hemisphere. When this amount declines, the rate of summer melt declines and the ice sheets begin to grow. In turn, this increases the amount of sunlight reflected back into space, increasing (or amplifying) the cooling trend. Eventually a new ice age emerges and lasts for about 100,000 years.
So what are today’s conditions like? Changes in both the orbit and tilt of the Earth do indeed indicate that the Earth should be cooling. However, two reasons explain why an ice age is unlikely:
1. These two factors, orbit and tilt, are weak and are not acting within the same timescale – they are out of phase by about 10,000 years. This means that their combined effect would probably be too weak to trigger an ice age. You have to go back 430,000 years to find an interglacial with similar conditions, and this interglacial lasted about 30,000 years.
2. The warming effect from CO2 and other greenhouse gases is greater than the cooling effect expected from natural factors. Without human interference, the Earth’s orbit and tilt, a slight decline in solar output since the 1950s and volcanic activity would have led to global cooling. Yet global temperatures are definitely on the rise.
It can therefore be concluded that with CO2 concentrations set to continue to rise, a return to ice age conditions seems very unlikely. Instead, temperatures are increasing and this increase may come at a considerable cost with few or no benefits.
1.4 Haven blir kallare!
Visa spoiler
- "Ocean heat touches on the very core of the AGW hypothesis: When all is said and done, if the climate system is not accumulating heat, the hypothesis is invalid... Now that heat accumulation has stopped (and perhaps even reversed), the tables have turned. The same criteria used to support their hypothesis, is now being used to falsify it. It is evident that the AGW hypothesis, as it now stands, is either false or fundamentally inadequate." (William DiPuccio)
Vad fakta pekar på:
"In 2008, climate change sceptic Roger Pielke Sr said this: “Global warming, as diagnosed by upper ocean heat content has not been occurring since 2004”. It is a fine example of denialist spin, making several extraordinary leaps:
*
that one symptom is indicative of the state of an entire malaise (e.g. not being short of breath one day means your lung cancer is cured).
*
that one can claim significance about a four year period when it’s too short to draw any kind of conclusion
*
that global warming has not been occurring on the basis of ocean temperatures alone
So much for the hype. What does the science say about the temperature of the oceans – which, after all, constitute about 70% of the Earth’s surface? The oceans store approximately 80% of all the energy in the Earth’s climate, so ocean temperatures are a key indicator for global warming.
No straight lines
Claims that the ocean has been cooling are correct. Claims that global warming has stopped are not. It is an illogical position: the climate is subject to a lot of natural variability, so the premise that changes should be ‘monotonic’ – temperatures rising in straight lines – ignores the fact that nature doesn’t work like that. This is why scientists normally discuss trends – 30 years or more – so that short term fluctuations can be seen as part of a greater pattern. (Other well-known cyclic phenomena like El Nino and La Nina play a part in these complex interactions).
Looking at the trend in ocean heat, this is what we find:

Source: Levitus 2009
There are, however, disputes about the accuracy of Argo buoys and expendable measuring devices dropped into the sea, and the reporting of temperatures down to only 700 metres. How do scientists resolve these kind of disputes – bearing in mind that such disputes are the very stuff of science, the essence of true scepticism? One way is to find more data sources – different ways of measuring the phenomenon in dispute. By using results from seven different teams of scientists, all using different tools and methods, we are able to see a clear trend. And while there is variation between team results due to the differences in technique and measurement methods, one thing they all agree on: long term, temperatures are going up.

Source: Lyman 2010
The reaction of the oceans to climate change are some of the most profound across the entire environment, including disruption of the ocean food chain through chemical changes caused by CO2, the ability of the sea to absorb CO2 being limited by temperature increases, (and the potential to expel sequestered CO2 back into the atmosphere as the water gets hotter), sea-level rise due to thermal expansion, and the amount of water vapour in the atmosphere.
While there is a great deal we don’t know about how the oceans behave, we do however know that it’s safer to discuss all aspects of climate change using multiple sets of data, rather than just one, as Pielke Sr did. If ocean heat is a guide, then global warming is still on track to cause great disruption if we don’t modify our actions to reduce the release of anthropogenic CO2.
Claims that global warming is not happening on the basis of short-term ocean temperatures are not supported by the evidence."
Vad fakta pekar på:
"In 2008, climate change sceptic Roger Pielke Sr said this: “Global warming, as diagnosed by upper ocean heat content has not been occurring since 2004”. It is a fine example of denialist spin, making several extraordinary leaps:
*
that one symptom is indicative of the state of an entire malaise (e.g. not being short of breath one day means your lung cancer is cured).
*
that one can claim significance about a four year period when it’s too short to draw any kind of conclusion
*
that global warming has not been occurring on the basis of ocean temperatures alone
So much for the hype. What does the science say about the temperature of the oceans – which, after all, constitute about 70% of the Earth’s surface? The oceans store approximately 80% of all the energy in the Earth’s climate, so ocean temperatures are a key indicator for global warming.
No straight lines
Claims that the ocean has been cooling are correct. Claims that global warming has stopped are not. It is an illogical position: the climate is subject to a lot of natural variability, so the premise that changes should be ‘monotonic’ – temperatures rising in straight lines – ignores the fact that nature doesn’t work like that. This is why scientists normally discuss trends – 30 years or more – so that short term fluctuations can be seen as part of a greater pattern. (Other well-known cyclic phenomena like El Nino and La Nina play a part in these complex interactions).
Looking at the trend in ocean heat, this is what we find:
Source: Levitus 2009
There are, however, disputes about the accuracy of Argo buoys and expendable measuring devices dropped into the sea, and the reporting of temperatures down to only 700 metres. How do scientists resolve these kind of disputes – bearing in mind that such disputes are the very stuff of science, the essence of true scepticism? One way is to find more data sources – different ways of measuring the phenomenon in dispute. By using results from seven different teams of scientists, all using different tools and methods, we are able to see a clear trend. And while there is variation between team results due to the differences in technique and measurement methods, one thing they all agree on: long term, temperatures are going up.
Source: Lyman 2010
The reaction of the oceans to climate change are some of the most profound across the entire environment, including disruption of the ocean food chain through chemical changes caused by CO2, the ability of the sea to absorb CO2 being limited by temperature increases, (and the potential to expel sequestered CO2 back into the atmosphere as the water gets hotter), sea-level rise due to thermal expansion, and the amount of water vapour in the atmosphere.
While there is a great deal we don’t know about how the oceans behave, we do however know that it’s safer to discuss all aspects of climate change using multiple sets of data, rather than just one, as Pielke Sr did. If ocean heat is a guide, then global warming is still on track to cause great disruption if we don’t modify our actions to reduce the release of anthropogenic CO2.
Claims that global warming is not happening on the basis of short-term ocean temperatures are not supported by the evidence."
1.5 "Climategate"-mailen antyder en konspiration!
Visa spoiler
- "Hackers have broken into the database of the University of East Anglia’s Climatic Research Unit - and put the files they stole on the Internet. The 1079 emails and 72 documents seem indeed evidence of a scandal involving scientists pushing the man-made warming theory, suggesting conspiracy, collusion in exaggerating warming data, possibly illegal destruction of embarrassing information, organised resistance to disclosure, manipulation of data, private admissions of flaws in their public claims and much more. (Andrew Bolt, Herald Sun)"
Vad fakta pekar på:
"Exhibit No. 1 of the climate conspiracy theory is a collection of emails stolen from the Climatic Research Unit (CRU) of the University of East Anglia (UEA), which appeared on the internet in November 2009.
Founded in 1972, CRU is only a small research unit with around 16 staff. CRU is best known for its work, since 1978, on a global record of instrumental temperature measurements from 1850 to the present, or CRUTEM. CRU’s land surface temperatures are combined with the UK Met Office Hadley Centre’s sea surface temperatures to form the global land-ocean record HadCRUT. CRU has also published reconstructions of pre-1850 temperatures based on tree rings, and CRU scientists have been involved in the Intergovernmental Panel on Climate Change (IPCC).
The 1,073 emails span 13 years of correspondence between colleagues at CRU. Much of it is mundane, but in this digital age it took only a matter of hours for contrarians to do some quote-mining. Contrarians alleged that the CRU scientists had manipulated temperature and tree ring data to support predetermined conclusions, that they had stonewalled Freedom of Information (FoI) requests for data, and that they had corrupted the peer review and IPCC processes.
The story was quickly dubbed “Climategate”, and it spread rapidly from arcane contrarian blogs through conservative columnists to the mainstream media. The hyperbole was turned up to eleven. Conspiracy theorists had a field day, claiming that anyone even mentioned in the emails, or remotely connected to CRU, must also be part of a conspiracy. In this way, the Climategate conspiracy theory snowballed to include the entire field of climate science. The Climategate emails were held up as “the final nail in the coffin of anthropogenic global warming”, and the media were only too happy to play up the controversy.
The CRU scientists have been cleared
In the months that followed, there were several inquiries into the allegations resulting from the emails. When a few of the more suggestive email quotes are reeled off by pundits without much context, they can sound pretty damning. But each and every one of these inquiries has found no fraud and no conspiracy.
The most comprehensive inquiry was the Independent Climate Change Email Review led by Sir Muir Russell, commissioned by UEA to examine the behaviour of the CRU scientists (but not the scientific validity of their work). It published its final report in July 2010. This inquiry was no whitewash: it examined the main allegations arising from the emails and their implications in meticulous detail. It focused on what the CRU scientists did, not what they said, investigating the evidence for and against each allegation. It interviewed CRU and UEA staff, and took 111 submissions including one from CRU itself. And it also did something the media completely failed to do: it attempted to put the actions of CRU scientists into context.
The Review went back to primary sources to see if CRU really was hiding or falsifying their data. It considered how much CRU’s actions influenced the IPCC’s conclusions about temperatures during the past millennium. It commissioned a paper by Dr Richard Horton, editor of The Lancet, on the context of scientific peer review. It asked IPCC Review Editors how much influence individuals could wield on writing groups. And it reviewed the university's FoI processes and CRU's compliance with them. Many of these are things any journalist could have done relatively easily, but few ever bothered to do.
The Review also commented on the broader context of science in the 21st century. To paraphrase from Chapter 5: the emergence of the blogosphere requires significantly more openness from scientists. However, providing the details necessary to validate large datasets can be difficult and time-consuming, and how FoI laws apply to research is still an evolving area. Meanwhile, the public needs to understand that science cannot and does not produce absolutely precise answers. Though the uncertainties may become smaller and better constrained over time, uncertainty in science is a fact of life which policymakers have to deal with. The chapter concludes: “the Review would urge all scientists to learn to communicate their work in ways that the public can access and understand”.
The Review points out the well-known psychological phenomenon that email is less formal than other forms of communication: “Extreme forms of language are frequently applied to quite normal situations by people who would never use it in other communication channels.” The CRU scientists assumed their emails to be private, so they used “slang, jargon and acronyms” which would have been more fully explained had they been talking to the public. And although some emails suggest CRU went out of their way to make life difficult for their critics, there are others which suggest they were bending over backwards to be honest. Therefore the Review found “the e-mails cannot always be relied upon as evidence of what actually occurred, nor indicative of actual behaviour that is extreme, exceptional or unprofessional.” [section 4.3]
So when put into the proper context, what do these emails actually reveal about the behaviour of the CRU scientists? The report concluded (its emphasis):
Climate science is a matter of such global importance, that the highest standards of honesty, rigour, and openness are needed in its conduct. On the specific allegations made against the behaviour of CRU scientists, we find that their rigour and honesty as scientists are not in doubt.
In addition, we do not find that their behaviour has prejudiced the balance of advice given to policy makers. In particular, we did not find any evidence of behaviour that might undermine the conclusions of the IPCC assessments.
But we do find that there has been a consistent pattern of failing to display the proper degree of openness, both on the part of the CRU scientists and on the part of the UEA, who failed to recognize not only the significance of statutory requirements but also the risk to the reputation of the University and indeed, to the credibility of UK climate science. [1.3]
These general findings are more or less consistent across the various allegations the Review investigated. Its specific findings are summarized in the following rebuttals: "Did CRU tamper with temperature data?", "What does Mike's Nature trick to 'hide the decline' mean?", "Climategate and the peer-review process", "Were skeptic scientists kept out of the IPCC?", and "Climategate and the Freedom of Information (FOI) requests".
The science is unchanged by Climategate
The argument that Climategate reveals an international climate science conspiracy is not really a very skeptical one. It is skeptical in the weak sense of questioning authority, but it stops there. Unlike true skepticism, it doesn’t go on to objectively examine all the evidence and draw a conclusion based on that evidence. Instead, it cherry-picks suggestive emails, seeing everything as incontrovertible evidence of a conspiracy, and concludes all of mainstream climate science is guilty by association. This is not skepticism; this is conspiracy theory.
In reality, Climategate has not thrown any legitimate doubt on CRU’s results, let alone the conclusions of the entire climate science community. The entire work of CRU comprises only a small part of the evidence for AGW. There are all sorts of lines of evidence for global warming, and for a human influence on climate, which in no way depend on the behaviour of the CRU scientists. Global warming has been observed not just on land but also over the oceans and in the troposphere, as well as being confirmed by many other indicators such as ocean heat content, humidity, sea level, glaciers, and Arctic sea ice. And while the hockey stick tells us that humans have caused a profound disturbance to our climate system, we don’t need it to know that humans are causing global warming. The pattern of warming we observe is the same as that long predicted for greenhouse warming: the stratosphere is cooling, nights have warmed faster than days, and winters faster than summers.
But this reality doesn’t fit into the narrative that the contrarians would like to tell: that AGW is a house of cards that is falling down. It is very difficult to attack all of these diverse lines of evidence for global warming. Instead they tend to focus on some of the better publicized ones and try to associate them with a few individuals, making a much easier target. Yet while contrarians have been nosing around in scientists’ emails, the actual science has, if anything, become more concerning. Many major studies during 2009 and 2010 found things may be worse than previously thought.
Far from exposing a global warming fraud, “Climategate” merely exposed the depths to which contrarians are willing to sink in their attempts to manufacture doubt about AGW. They cannot win the argument on scientific grounds, so now they are trying to discredit researchers themselves. Climategate was a fake scandal from beginning to end, and the media swallowed it hook, line, and sinker. The real scandal is the attacks on climate science which have done untold damage to the reputation of the scientists involved, public trust in science, and the prospects of mitigating future warming."
- "Scientists tried to 'hide the decline' in global temperature
'Perhaps the most infamous example of this comes from the "hide the decline" email. This email initially garnered widespread media attention, as well as significant disagreement over its implications. In our view, the email, as well as the contextual history behind it, appears to show several scientists eager to present a particular viewpoint-that anthropogenic emissions are largely responsible for global warming-even when the data showed something different." (David Lungren)
"There are a number of misconceptions concerning Phil Jones' email. When one takes the time to read the email and understand the science discussed, the misconceptions are easily put into proper context.
The "decline" is about northern tree-rings, not global temperature
Phil Jones' email is often cited as evidence of an attempt to "hide the decline in global temperatures". This claim is patently false and demonstrates ignorance of the science discussed. The decline actually refers to a decline in tree growth at certain high-latitude locations since 1960.
Tree-ring growth has been found to match well with temperature and hence tree-rings are used to plot temperature going back hundreds of years. However, tree-rings in some high-latitude locations diverge from modern instrumental temperature records after 1960. This is known as the "divergence problem". Consequently, tree-ring data in these high-latitude locations are not considered reliable after 1960 and should not be used to represent temperature in recent decades.
The "decline" has nothing to do with "Mike's trick".
Phil Jones talks about "Mike's Nature trick" and "hide the decline" as two separate techniques. However, people often abbreviate the email, distilling it down to "Mike's trick to hide the decline". Professor Richard Muller from Berkeley commits this error in a public lecture:
"A quote came out of the emails, these leaked emails, that said "let's use Mike's trick to hide the decline". That's the words, "let's use Mike's trick to hide the decline". Mike is Michael Mann, said "hey, trick just means mathematical trick. That's all." My response is I'm not worried about the word trick. I'm worried about the decline."
Muller quotes "Mike's nature trick to hide the decline" as if its Phil Jones's actual words. However, the original text indicates otherwise:
"I’ve just completed Mike’s Nature trick of adding in the real temps to each series for the last 20 years (ie from 1981 onwards) and from 1961 for Keith’s to hide the decline."
It's clear that "Mike's Nature trick" is quite separate to Keith Briffa's "hide the decline". "Mike's Nature trick" refers to a technique (in other words, "trick of the trade") by Michael Mann to plot recent instrumental data along with reconstructed past temperature. This places recent global warming trends in the context of temperature changes over longer time scales.
There is nothing secret about "Mike's trick". Both the instrumental and reconstructed temperature are clearly labelled. To claim this is some sort of secret, nefarious "trick", or to confuse this with "hide the decline", displays either ignorance or a willingness to mislead.

igure 1: Northern Hemisphere mean temperature anomaly in °C (Mann et al 1999).
The "decline" has been openly and publicly discussed since 1995
While skeptics like to portray "the decline" as a phenomena that climate scientists have tried to keep secret, the divergence problem has been publicly discussed in the peer-reviewed literature since 1995 (Jacoby 1995). The IPCC discuss the decline in tree-ring growth openly both in the 2001 Third Assessment Report and in even more detail in the 2007 Fourth Assessment Report.
The common misconception that scientists tried to hide a decline in global temperatures is false. The decline in tree-ring growth is plainly discussed in the publicly available scientific literature. The divergence in tree-ring growth does not change the fact that we are currently observing many lines of evidence for global warming. The obsessive focus on a short quote, often misquoted and taken out of context, doesn't change the scientific case that human-caused climate change is real."
- "Trenberth can't account for the lack of warming
in one e-mail, a top "warmist" researcher admits it’s a "travesty" that "we can’t account for the lack of warming at the moment." As it happens, the writer of that October 2009 e-mail—Kevin Trenberth, a lead author of the warmist bible, the 2007 Intergovernmental Panel on Climate Change (IPCC) report—told Congress two years ago that evidence for manmade warming is "unequivocal." He claimed "the planet is running a ’fever’ and the prognosis is that it is apt to get much worse." But Trenberth’s "lack of warming at the moment" has been going on at least a decade." (Michael Fumento)
"This has been most commonly interpreted (among skeptics) as climate scientists secretly admitting amongst themselves that global warming really has stopped. Is this what Trenberth is saying? If one takes a little time to understand the science that Trenberth is discussing, his meaning becomes clear.
If you read the full email, you learn that Trenberth is actually informing fellow climate scientists about a paper he'd recently published, An imperative for climate change planning: tracking Earth's global energy (Trenberth 2009). The paper discusses the planet's energy budget - how much net energy is flowing into our climate and where it's going. It also discusses the systems we have in place to track energy flow in and out of our climate system.
Trenberth states unequivocally that our planet is continually heating due to increasing carbon dioxide. This energy imbalance was very small 40 years ago but has steadily increased to around 0.9 W/m2 over the 2000 to 2005 period, as observed by satellites. Preliminary satellite data indicates the energy imbalance has continued to increase from 2006 to 2008. The net result is that the planet is continuously accumulating heat. Global warming is still happening.
Next, Trenberth wonders with this ever increasing heat, why doesn't surface temperature continuously rise? The standard answer is "natural variability". But such a general answer doesn't explain the actual physical processes involved. If the planet is accumulating heat, the energy must go somewhere. Is it going into melting ice? Is it being sequestered deep in the ocean? Did the 2008 La Nina rearrange the configuration of ocean heat? Is it all of the above? Trenberth wants answers!
So like an obsessive accountant, Trenberth pores over the energy budget, tallying up the joules accumulating in various parts of the climate. A global energy imbalance of 0.9 W/m2 means the planet is accumulating 145 x 1020 joules per year. The following list gives the amount of energy going into various parts of the climate over the 2004 to 2008 period:
*
Land: 2 x 10²⁰ joules per year
*
Arctic sea Ice: 1 x 10²⁰ joules per year
*
Ice sheets: 1.4 x 10²⁰ joules per year
*
Total land ice: between 2 to 3 x 10²⁰ joules per year
*
Ocean: between 20 to 95 x 1020 joules per year
*
Sun: 16 x 1020 joules per year (eg - the sun has been cooling from 2004 to 2008)
These various contributions total between 45 to 115 x 1020 joules per year. This falls well short of the total 145 x 1020 joules per year (although the error bars do overlap). Trenberth expresses frustration that observation systems are inadequate to track the flow of energy. It's not that global warming has stopped. We know global warming has continued because satellites find an energy imbalance. It's that our observation systems need to be more accurate in tracking the energy flows through our climate and closing the energy budget.
So what may be causing the discrepancy? As the ocean heat data only goes to 900 metre depth, Trenberth suggests that perhaps heat is being sequestered below 900 metres. There is support for this idea in a later paper von Schuckmann 2009. This paper uses Argo buoy data to calculate ocean heat down to 2000 metres depth. From 2003 to 2008, the world's oceans have been accumulating heat at a rate of 0.77 W/m2. This higher trend for ocean heat would bring the total energy build-up more in line with satellite measurements of net energy imbalance. However, von Schuckmann's results were published after Trenberth's paper so I look forward to seeing how this plays out in future papers.
So to summarise, Trenberth's email says this:
"The fact is that we can't account for the lack of warming at the moment and it is a travesty that we can't."
After reviewing the discussion in Trenberth 2009, it's apparent that what he meant was this:
"Global warming is still happening - our planet is still accumulating heat. But our observation systems aren't able to comprehensively keep track of where all the energy is going. Consequently, we can't definitively explain why surface temperatures have gone down in the last few years. That's a travesty!"
Skeptics use Trenberth's email to characterise climate scientists as secretive and deceptive. However, when one takes the trouble to acquaint oneself with the science, the opposite becomes apparent. Trenberth outlines his views in a clear, open manner, frankly articulating his frustrations at the limitations of observation systems. Trenberth's opinions didn't need to be illegally stolen and leaked onto the internet. They were already publicly available in the peer reviewed literature - and much less open to misinterpretation than a quote-mined email."
- "Freedom of Information (FOI) requests were ignored
"The emails suggest that the authors co-operated (perhaps the word is “conspired”) to prevent data from being made available to other researchers through either data archiving requests or through the Freedom of Information Acts of both the U.S. and the UK." (Pajamas Media)
"The Independent Climate Change Email Review found the CRU scientists were unhelpful and unsympathetic to information requesters and at times broke FoI laws. However, CRU is a small research unit with limited resources, and they perceived the requesters were not acting in good faith. The same inquiry found the rigour and honesty of the scientists are not in doubt, and their behaviour did not prejudice the advice given to policymakers.
Exhibit No. 1 of the climate conspiracy theory is a collection of emails stolen from the Climatic Research Unit (CRU) of the University of East Anglia (UEA), which appeared on the internet in November 2009. Though some of these "Climategate" emails can sound damning when quoted out of context, several inquiries have cleared the scientists. The most comprehensive inquiry was the Independent Climate Change Email Review.
One allegation arising from the emails (and arguably the only instance where there is actually a case to be answered) is that Freedom of Information requests received by CRU were wrongly denied. Meanwhile, defenders of CRU “have suggested that a number of these FoIA requests were inappropriate or frivolous.” [10.2]
Below I have reproduced some of the emails often quoted in support of these allegations (all were written by Phil Jones):
7/5/2004: Many of us in the paleo field get requests from skeptics (mainly a guy called Steve McIntyre in Canada) asking us for series. Mike and I are not sending anything, partly because we don’t have some of the series he wants, also partly as we’ve got the data through contacts like you, but mostly because he’ll distort and misuse them. Despite this, Mike and I would like to make as many of the series we’ve used in the [Reviews of Geophysics] plots available from the CRU web page.
2/2/2005: [D]on’t leave stuff lying around on ftp sites — you never know who is trawling them. The two MMs have been after the CRU station data for years. If they ever hear there is a Freedom of Information Act now in the UK, I think I’ll delete the file rather than send to anyone. Does your similar act in the US force you to respond to enquiries within 20 days? - our does! […] Tom Wigley has sent me a worried email when he heard about it—thought people could ask him for his model code. He has retired officially from UEA so he can hide behind that.
21/2/2005: I’m getting hassled by a couple of people to release the CRU station temperature data. Don’t any of you three tell anybody that the UK has a Freedom of Information Act!
27/4/2005: I got this email from McIntyre a few days ago. As far as I’m concerned he has the data — sent ages ago. I’ll tell him this, but that’s all — no code. If I can find it, it is likely to be hundreds of lines of uncommented fortran ! I recall the program did a lot more than just average the series. I know why he can’t replicate the results early on — it is because there was a variance correction for fewer series.
29/5/2008: Can you delete any emails you may have had with Keith re AR4? Keith will do likewise. […] Can you email Gene and get him to do the same? […] We will be getting Caspar to do likewise.
3/12/2008: When the FOI requests began here, the FOI person said we had to abide by the requests. It took a couple of half hour sessions — one at a screen, to convince them otherwise showing them what CA was all about. Once they became aware of the types of people we were dealing with, everyone at UEA […] became very supportive. […] The inadvertent email I sent last month has led to a Data Protection Act request sent by a certain Canadian, saying that the email maligned his scientific credibility with his peers! If he pays 10 pounds (which he hasn’t yet) I am supposed to go through my emails and he can get anything I’ve written about him. About 2 months ago I deleted loads of emails, so have very little — if anything at all.
10/12/2008: Haven’t got a reply from the FOI person here at UEA. So I’m not entirely confident the numbers are correct. One way of checking would be to look on CA, but I’m not doing that. I did get an email from the FOI person here early yesterday to tell me I shouldn’t be deleting emails — unless this was ‘normal’ deleting to keep emails manageable! […] According to the FOI Commissioner’s Office, IPCC is an international organisation, so is above any national FOI. Even if UEA holds anything about IPCC, we are not obliged to pass it on, unless it has anything to do with our core business — and it doesn’t. I’m sounding like Sir Humphrey here! McIntyre often gets others to do the requesting, but requests and responses all get posted up on CA regardless of who sends them.
The general allegation is that CRU incorrectly denied FoI requests. In particular, the Review focused on the question of whether UEA’s formal processes for dealing with FoI requests were “fair and impartial”.
The Review Team interviewed the relevant UEA and CRU staff, as well as representatives of the Information Commissioner’s Office (ICO). UEA’s FoI process is centred around their Information Policy & Compliance Manager (IPCM). In the two years after current laws came into effect at the start of 2005, no requests for information were logged with the IPCM, though we know from the emails that there were such requests. We know from the IPCM log that CRU received four requests in 2007, two in 2008, and one in the first half of 2009 (four were fully granted and three rejected).
Then came the storm. Between 24 July and 28 July, CRU received no less than 60 FoI requests, and 10 more between 31 July and 14 August. The requesters demanded access to both raw temperature station data and any related confidentiality agreements. The Review found evidence that this was an organized campaign (one request asked for information “involving the following countries: [insert 5 or so countries that are different from ones already requested]”). The Review says “such orchestrated campaigns [have] literally overwhelming impacts on small research units.”
The Review found there was “insufficient priority given from the UEA centre to motivating staff and to prompting continuing education” about their legal requirements under FoI law. Similarly, they found “a lack of engagement by core CRU team”, as well as “a tendency to assume that no action was required until precedents had been set”. Some of the emails suggest a “lack of sympathy with the requesters” and “a tendency to answer the wrong question or to give a partial answer.” [10.5]
“There seems clear incitement to delete e-mails, although we have seen no evidence of any attempt to delete information in respect of a request already made.” (The former is legal but not the latter.) The email dated 3/12/2008 included “a clear statement that e-mails had been deleted […] It seems likely that many of these ‘deleted’ e-mails subsequently became public following the unauthorized release from the backup server.” [10.5]
The Review found that the IPCM “may have lacked […] the authority to challenge the assertions of senior professors” and “the UEA senior staff need to take more explicit responsibility for these processes”. He told the Review he felt “very much the bull’s eye at the centre of the target”. He explicitly denied that he “became very supportive” as suggested by Jones. The 10/12/2008 email provides “evidence that the IPCM did try to warn Prof. Jones about deliberate deletion of information”. [10.5]
In general, “[t]he Review found an ethos of minimal compliance (and at times non-compliance) by the CRU with both the letter and the spirit of the FoIA and EIR. We believe that this must change”. The Review also made it clear that CRU did not receive enough support from UEA management, and made recommendations to the university on how it should handle future information requests. It also recommended to the ICO that it engage more with universities and clarify how FoI law applies to research.
However, as Steve Easterbrook commented, the Review “never really acknowledges the problems a small research unit (varying between 3.5 to 5 FTE staff over the last decade) would have in finding the resources and funding to be an early adopter in open data and public communication, while somehow managing to do cutting edge research in its area of expertise too.” The Review does point out that in the years since CRU was founded climate science has developed from “a relatively obscure area of science […] into an area of great political and public concern.”
The Review concluded:
[W]e find that a fundamental lack of engagement by the CRU team with their obligations under FoIA/EIR, both prior to 2005 and subsequently, led to an overly defensive approach that set the stage for the subsequent mass of FoIA/EIR requests in July and August 2009. We recognize that there was deep suspicion within CRU, as to the motives of those making detailed requests. Nevertheless, the requirements of the legislation for release of information are clear and early action would likely have prevented much subsequent grief. [10.6]
As Phil Jones has admitted, CRU did the wrong thing with regard to Freedom of Information requests. However, they clearly perceived that the requests were not being made in good faith. The Review apparently made no attempt to investigate the motivations of the requesters.
But all this must be considered in the context of the Review's general findings (summarised here): although the scientists failed to display the proper degree of openness, their rigour and honesty are not in doubt, and their behaviour did not prejudice the advice given to policymakers. Despite being heralded as “the final nail in the coffin of anthropogenic global warming”, Climategate has not even invalidated CRU's results, let alone the conclusions of the climate science community. In any case, the entire work of CRU comprises only a small part of the large body of evidence for anthropogenic global warming. That mountain of evidence cannot be explained away by the behaviour of a few individuals."
Vad fakta pekar på:
"Exhibit No. 1 of the climate conspiracy theory is a collection of emails stolen from the Climatic Research Unit (CRU) of the University of East Anglia (UEA), which appeared on the internet in November 2009.
Founded in 1972, CRU is only a small research unit with around 16 staff. CRU is best known for its work, since 1978, on a global record of instrumental temperature measurements from 1850 to the present, or CRUTEM. CRU’s land surface temperatures are combined with the UK Met Office Hadley Centre’s sea surface temperatures to form the global land-ocean record HadCRUT. CRU has also published reconstructions of pre-1850 temperatures based on tree rings, and CRU scientists have been involved in the Intergovernmental Panel on Climate Change (IPCC).
The 1,073 emails span 13 years of correspondence between colleagues at CRU. Much of it is mundane, but in this digital age it took only a matter of hours for contrarians to do some quote-mining. Contrarians alleged that the CRU scientists had manipulated temperature and tree ring data to support predetermined conclusions, that they had stonewalled Freedom of Information (FoI) requests for data, and that they had corrupted the peer review and IPCC processes.
The story was quickly dubbed “Climategate”, and it spread rapidly from arcane contrarian blogs through conservative columnists to the mainstream media. The hyperbole was turned up to eleven. Conspiracy theorists had a field day, claiming that anyone even mentioned in the emails, or remotely connected to CRU, must also be part of a conspiracy. In this way, the Climategate conspiracy theory snowballed to include the entire field of climate science. The Climategate emails were held up as “the final nail in the coffin of anthropogenic global warming”, and the media were only too happy to play up the controversy.
The CRU scientists have been cleared
In the months that followed, there were several inquiries into the allegations resulting from the emails. When a few of the more suggestive email quotes are reeled off by pundits without much context, they can sound pretty damning. But each and every one of these inquiries has found no fraud and no conspiracy.
The most comprehensive inquiry was the Independent Climate Change Email Review led by Sir Muir Russell, commissioned by UEA to examine the behaviour of the CRU scientists (but not the scientific validity of their work). It published its final report in July 2010. This inquiry was no whitewash: it examined the main allegations arising from the emails and their implications in meticulous detail. It focused on what the CRU scientists did, not what they said, investigating the evidence for and against each allegation. It interviewed CRU and UEA staff, and took 111 submissions including one from CRU itself. And it also did something the media completely failed to do: it attempted to put the actions of CRU scientists into context.
The Review went back to primary sources to see if CRU really was hiding or falsifying their data. It considered how much CRU’s actions influenced the IPCC’s conclusions about temperatures during the past millennium. It commissioned a paper by Dr Richard Horton, editor of The Lancet, on the context of scientific peer review. It asked IPCC Review Editors how much influence individuals could wield on writing groups. And it reviewed the university's FoI processes and CRU's compliance with them. Many of these are things any journalist could have done relatively easily, but few ever bothered to do.
The Review also commented on the broader context of science in the 21st century. To paraphrase from Chapter 5: the emergence of the blogosphere requires significantly more openness from scientists. However, providing the details necessary to validate large datasets can be difficult and time-consuming, and how FoI laws apply to research is still an evolving area. Meanwhile, the public needs to understand that science cannot and does not produce absolutely precise answers. Though the uncertainties may become smaller and better constrained over time, uncertainty in science is a fact of life which policymakers have to deal with. The chapter concludes: “the Review would urge all scientists to learn to communicate their work in ways that the public can access and understand”.
The Review points out the well-known psychological phenomenon that email is less formal than other forms of communication: “Extreme forms of language are frequently applied to quite normal situations by people who would never use it in other communication channels.” The CRU scientists assumed their emails to be private, so they used “slang, jargon and acronyms” which would have been more fully explained had they been talking to the public. And although some emails suggest CRU went out of their way to make life difficult for their critics, there are others which suggest they were bending over backwards to be honest. Therefore the Review found “the e-mails cannot always be relied upon as evidence of what actually occurred, nor indicative of actual behaviour that is extreme, exceptional or unprofessional.” [section 4.3]
So when put into the proper context, what do these emails actually reveal about the behaviour of the CRU scientists? The report concluded (its emphasis):
Climate science is a matter of such global importance, that the highest standards of honesty, rigour, and openness are needed in its conduct. On the specific allegations made against the behaviour of CRU scientists, we find that their rigour and honesty as scientists are not in doubt.
In addition, we do not find that their behaviour has prejudiced the balance of advice given to policy makers. In particular, we did not find any evidence of behaviour that might undermine the conclusions of the IPCC assessments.
But we do find that there has been a consistent pattern of failing to display the proper degree of openness, both on the part of the CRU scientists and on the part of the UEA, who failed to recognize not only the significance of statutory requirements but also the risk to the reputation of the University and indeed, to the credibility of UK climate science. [1.3]
These general findings are more or less consistent across the various allegations the Review investigated. Its specific findings are summarized in the following rebuttals: "Did CRU tamper with temperature data?", "What does Mike's Nature trick to 'hide the decline' mean?", "Climategate and the peer-review process", "Were skeptic scientists kept out of the IPCC?", and "Climategate and the Freedom of Information (FOI) requests".
The science is unchanged by Climategate
The argument that Climategate reveals an international climate science conspiracy is not really a very skeptical one. It is skeptical in the weak sense of questioning authority, but it stops there. Unlike true skepticism, it doesn’t go on to objectively examine all the evidence and draw a conclusion based on that evidence. Instead, it cherry-picks suggestive emails, seeing everything as incontrovertible evidence of a conspiracy, and concludes all of mainstream climate science is guilty by association. This is not skepticism; this is conspiracy theory.
In reality, Climategate has not thrown any legitimate doubt on CRU’s results, let alone the conclusions of the entire climate science community. The entire work of CRU comprises only a small part of the evidence for AGW. There are all sorts of lines of evidence for global warming, and for a human influence on climate, which in no way depend on the behaviour of the CRU scientists. Global warming has been observed not just on land but also over the oceans and in the troposphere, as well as being confirmed by many other indicators such as ocean heat content, humidity, sea level, glaciers, and Arctic sea ice. And while the hockey stick tells us that humans have caused a profound disturbance to our climate system, we don’t need it to know that humans are causing global warming. The pattern of warming we observe is the same as that long predicted for greenhouse warming: the stratosphere is cooling, nights have warmed faster than days, and winters faster than summers.
But this reality doesn’t fit into the narrative that the contrarians would like to tell: that AGW is a house of cards that is falling down. It is very difficult to attack all of these diverse lines of evidence for global warming. Instead they tend to focus on some of the better publicized ones and try to associate them with a few individuals, making a much easier target. Yet while contrarians have been nosing around in scientists’ emails, the actual science has, if anything, become more concerning. Many major studies during 2009 and 2010 found things may be worse than previously thought.
Far from exposing a global warming fraud, “Climategate” merely exposed the depths to which contrarians are willing to sink in their attempts to manufacture doubt about AGW. They cannot win the argument on scientific grounds, so now they are trying to discredit researchers themselves. Climategate was a fake scandal from beginning to end, and the media swallowed it hook, line, and sinker. The real scandal is the attacks on climate science which have done untold damage to the reputation of the scientists involved, public trust in science, and the prospects of mitigating future warming."
- "Scientists tried to 'hide the decline' in global temperature
'Perhaps the most infamous example of this comes from the "hide the decline" email. This email initially garnered widespread media attention, as well as significant disagreement over its implications. In our view, the email, as well as the contextual history behind it, appears to show several scientists eager to present a particular viewpoint-that anthropogenic emissions are largely responsible for global warming-even when the data showed something different." (David Lungren)
"There are a number of misconceptions concerning Phil Jones' email. When one takes the time to read the email and understand the science discussed, the misconceptions are easily put into proper context.
The "decline" is about northern tree-rings, not global temperature
Phil Jones' email is often cited as evidence of an attempt to "hide the decline in global temperatures". This claim is patently false and demonstrates ignorance of the science discussed. The decline actually refers to a decline in tree growth at certain high-latitude locations since 1960.
Tree-ring growth has been found to match well with temperature and hence tree-rings are used to plot temperature going back hundreds of years. However, tree-rings in some high-latitude locations diverge from modern instrumental temperature records after 1960. This is known as the "divergence problem". Consequently, tree-ring data in these high-latitude locations are not considered reliable after 1960 and should not be used to represent temperature in recent decades.
The "decline" has nothing to do with "Mike's trick".
Phil Jones talks about "Mike's Nature trick" and "hide the decline" as two separate techniques. However, people often abbreviate the email, distilling it down to "Mike's trick to hide the decline". Professor Richard Muller from Berkeley commits this error in a public lecture:
"A quote came out of the emails, these leaked emails, that said "let's use Mike's trick to hide the decline". That's the words, "let's use Mike's trick to hide the decline". Mike is Michael Mann, said "hey, trick just means mathematical trick. That's all." My response is I'm not worried about the word trick. I'm worried about the decline."
Muller quotes "Mike's nature trick to hide the decline" as if its Phil Jones's actual words. However, the original text indicates otherwise:
"I’ve just completed Mike’s Nature trick of adding in the real temps to each series for the last 20 years (ie from 1981 onwards) and from 1961 for Keith’s to hide the decline."
It's clear that "Mike's Nature trick" is quite separate to Keith Briffa's "hide the decline". "Mike's Nature trick" refers to a technique (in other words, "trick of the trade") by Michael Mann to plot recent instrumental data along with reconstructed past temperature. This places recent global warming trends in the context of temperature changes over longer time scales.
There is nothing secret about "Mike's trick". Both the instrumental and reconstructed temperature are clearly labelled. To claim this is some sort of secret, nefarious "trick", or to confuse this with "hide the decline", displays either ignorance or a willingness to mislead.
igure 1: Northern Hemisphere mean temperature anomaly in °C (Mann et al 1999).
The "decline" has been openly and publicly discussed since 1995
While skeptics like to portray "the decline" as a phenomena that climate scientists have tried to keep secret, the divergence problem has been publicly discussed in the peer-reviewed literature since 1995 (Jacoby 1995). The IPCC discuss the decline in tree-ring growth openly both in the 2001 Third Assessment Report and in even more detail in the 2007 Fourth Assessment Report.
The common misconception that scientists tried to hide a decline in global temperatures is false. The decline in tree-ring growth is plainly discussed in the publicly available scientific literature. The divergence in tree-ring growth does not change the fact that we are currently observing many lines of evidence for global warming. The obsessive focus on a short quote, often misquoted and taken out of context, doesn't change the scientific case that human-caused climate change is real."
- "Trenberth can't account for the lack of warming
in one e-mail, a top "warmist" researcher admits it’s a "travesty" that "we can’t account for the lack of warming at the moment." As it happens, the writer of that October 2009 e-mail—Kevin Trenberth, a lead author of the warmist bible, the 2007 Intergovernmental Panel on Climate Change (IPCC) report—told Congress two years ago that evidence for manmade warming is "unequivocal." He claimed "the planet is running a ’fever’ and the prognosis is that it is apt to get much worse." But Trenberth’s "lack of warming at the moment" has been going on at least a decade." (Michael Fumento)
"This has been most commonly interpreted (among skeptics) as climate scientists secretly admitting amongst themselves that global warming really has stopped. Is this what Trenberth is saying? If one takes a little time to understand the science that Trenberth is discussing, his meaning becomes clear.
If you read the full email, you learn that Trenberth is actually informing fellow climate scientists about a paper he'd recently published, An imperative for climate change planning: tracking Earth's global energy (Trenberth 2009). The paper discusses the planet's energy budget - how much net energy is flowing into our climate and where it's going. It also discusses the systems we have in place to track energy flow in and out of our climate system.
Trenberth states unequivocally that our planet is continually heating due to increasing carbon dioxide. This energy imbalance was very small 40 years ago but has steadily increased to around 0.9 W/m2 over the 2000 to 2005 period, as observed by satellites. Preliminary satellite data indicates the energy imbalance has continued to increase from 2006 to 2008. The net result is that the planet is continuously accumulating heat. Global warming is still happening.
Next, Trenberth wonders with this ever increasing heat, why doesn't surface temperature continuously rise? The standard answer is "natural variability". But such a general answer doesn't explain the actual physical processes involved. If the planet is accumulating heat, the energy must go somewhere. Is it going into melting ice? Is it being sequestered deep in the ocean? Did the 2008 La Nina rearrange the configuration of ocean heat? Is it all of the above? Trenberth wants answers!
So like an obsessive accountant, Trenberth pores over the energy budget, tallying up the joules accumulating in various parts of the climate. A global energy imbalance of 0.9 W/m2 means the planet is accumulating 145 x 1020 joules per year. The following list gives the amount of energy going into various parts of the climate over the 2004 to 2008 period:
*
Land: 2 x 10²⁰ joules per year
*
Arctic sea Ice: 1 x 10²⁰ joules per year
*
Ice sheets: 1.4 x 10²⁰ joules per year
*
Total land ice: between 2 to 3 x 10²⁰ joules per year
*
Ocean: between 20 to 95 x 1020 joules per year
*
Sun: 16 x 1020 joules per year (eg - the sun has been cooling from 2004 to 2008)
These various contributions total between 45 to 115 x 1020 joules per year. This falls well short of the total 145 x 1020 joules per year (although the error bars do overlap). Trenberth expresses frustration that observation systems are inadequate to track the flow of energy. It's not that global warming has stopped. We know global warming has continued because satellites find an energy imbalance. It's that our observation systems need to be more accurate in tracking the energy flows through our climate and closing the energy budget.
So what may be causing the discrepancy? As the ocean heat data only goes to 900 metre depth, Trenberth suggests that perhaps heat is being sequestered below 900 metres. There is support for this idea in a later paper von Schuckmann 2009. This paper uses Argo buoy data to calculate ocean heat down to 2000 metres depth. From 2003 to 2008, the world's oceans have been accumulating heat at a rate of 0.77 W/m2. This higher trend for ocean heat would bring the total energy build-up more in line with satellite measurements of net energy imbalance. However, von Schuckmann's results were published after Trenberth's paper so I look forward to seeing how this plays out in future papers.
So to summarise, Trenberth's email says this:
"The fact is that we can't account for the lack of warming at the moment and it is a travesty that we can't."
After reviewing the discussion in Trenberth 2009, it's apparent that what he meant was this:
"Global warming is still happening - our planet is still accumulating heat. But our observation systems aren't able to comprehensively keep track of where all the energy is going. Consequently, we can't definitively explain why surface temperatures have gone down in the last few years. That's a travesty!"
Skeptics use Trenberth's email to characterise climate scientists as secretive and deceptive. However, when one takes the trouble to acquaint oneself with the science, the opposite becomes apparent. Trenberth outlines his views in a clear, open manner, frankly articulating his frustrations at the limitations of observation systems. Trenberth's opinions didn't need to be illegally stolen and leaked onto the internet. They were already publicly available in the peer reviewed literature - and much less open to misinterpretation than a quote-mined email."
- "Freedom of Information (FOI) requests were ignored
"The emails suggest that the authors co-operated (perhaps the word is “conspired”) to prevent data from being made available to other researchers through either data archiving requests or through the Freedom of Information Acts of both the U.S. and the UK." (Pajamas Media)
"The Independent Climate Change Email Review found the CRU scientists were unhelpful and unsympathetic to information requesters and at times broke FoI laws. However, CRU is a small research unit with limited resources, and they perceived the requesters were not acting in good faith. The same inquiry found the rigour and honesty of the scientists are not in doubt, and their behaviour did not prejudice the advice given to policymakers.
Exhibit No. 1 of the climate conspiracy theory is a collection of emails stolen from the Climatic Research Unit (CRU) of the University of East Anglia (UEA), which appeared on the internet in November 2009. Though some of these "Climategate" emails can sound damning when quoted out of context, several inquiries have cleared the scientists. The most comprehensive inquiry was the Independent Climate Change Email Review.
One allegation arising from the emails (and arguably the only instance where there is actually a case to be answered) is that Freedom of Information requests received by CRU were wrongly denied. Meanwhile, defenders of CRU “have suggested that a number of these FoIA requests were inappropriate or frivolous.” [10.2]
Below I have reproduced some of the emails often quoted in support of these allegations (all were written by Phil Jones):
7/5/2004: Many of us in the paleo field get requests from skeptics (mainly a guy called Steve McIntyre in Canada) asking us for series. Mike and I are not sending anything, partly because we don’t have some of the series he wants, also partly as we’ve got the data through contacts like you, but mostly because he’ll distort and misuse them. Despite this, Mike and I would like to make as many of the series we’ve used in the [Reviews of Geophysics] plots available from the CRU web page.
2/2/2005: [D]on’t leave stuff lying around on ftp sites — you never know who is trawling them. The two MMs have been after the CRU station data for years. If they ever hear there is a Freedom of Information Act now in the UK, I think I’ll delete the file rather than send to anyone. Does your similar act in the US force you to respond to enquiries within 20 days? - our does! […] Tom Wigley has sent me a worried email when he heard about it—thought people could ask him for his model code. He has retired officially from UEA so he can hide behind that.
21/2/2005: I’m getting hassled by a couple of people to release the CRU station temperature data. Don’t any of you three tell anybody that the UK has a Freedom of Information Act!
27/4/2005: I got this email from McIntyre a few days ago. As far as I’m concerned he has the data — sent ages ago. I’ll tell him this, but that’s all — no code. If I can find it, it is likely to be hundreds of lines of uncommented fortran ! I recall the program did a lot more than just average the series. I know why he can’t replicate the results early on — it is because there was a variance correction for fewer series.
29/5/2008: Can you delete any emails you may have had with Keith re AR4? Keith will do likewise. […] Can you email Gene and get him to do the same? […] We will be getting Caspar to do likewise.
3/12/2008: When the FOI requests began here, the FOI person said we had to abide by the requests. It took a couple of half hour sessions — one at a screen, to convince them otherwise showing them what CA was all about. Once they became aware of the types of people we were dealing with, everyone at UEA […] became very supportive. […] The inadvertent email I sent last month has led to a Data Protection Act request sent by a certain Canadian, saying that the email maligned his scientific credibility with his peers! If he pays 10 pounds (which he hasn’t yet) I am supposed to go through my emails and he can get anything I’ve written about him. About 2 months ago I deleted loads of emails, so have very little — if anything at all.
10/12/2008: Haven’t got a reply from the FOI person here at UEA. So I’m not entirely confident the numbers are correct. One way of checking would be to look on CA, but I’m not doing that. I did get an email from the FOI person here early yesterday to tell me I shouldn’t be deleting emails — unless this was ‘normal’ deleting to keep emails manageable! […] According to the FOI Commissioner’s Office, IPCC is an international organisation, so is above any national FOI. Even if UEA holds anything about IPCC, we are not obliged to pass it on, unless it has anything to do with our core business — and it doesn’t. I’m sounding like Sir Humphrey here! McIntyre often gets others to do the requesting, but requests and responses all get posted up on CA regardless of who sends them.
The general allegation is that CRU incorrectly denied FoI requests. In particular, the Review focused on the question of whether UEA’s formal processes for dealing with FoI requests were “fair and impartial”.
The Review Team interviewed the relevant UEA and CRU staff, as well as representatives of the Information Commissioner’s Office (ICO). UEA’s FoI process is centred around their Information Policy & Compliance Manager (IPCM). In the two years after current laws came into effect at the start of 2005, no requests for information were logged with the IPCM, though we know from the emails that there were such requests. We know from the IPCM log that CRU received four requests in 2007, two in 2008, and one in the first half of 2009 (four were fully granted and three rejected).
Then came the storm. Between 24 July and 28 July, CRU received no less than 60 FoI requests, and 10 more between 31 July and 14 August. The requesters demanded access to both raw temperature station data and any related confidentiality agreements. The Review found evidence that this was an organized campaign (one request asked for information “involving the following countries: [insert 5 or so countries that are different from ones already requested]”). The Review says “such orchestrated campaigns [have] literally overwhelming impacts on small research units.”
The Review found there was “insufficient priority given from the UEA centre to motivating staff and to prompting continuing education” about their legal requirements under FoI law. Similarly, they found “a lack of engagement by core CRU team”, as well as “a tendency to assume that no action was required until precedents had been set”. Some of the emails suggest a “lack of sympathy with the requesters” and “a tendency to answer the wrong question or to give a partial answer.” [10.5]
“There seems clear incitement to delete e-mails, although we have seen no evidence of any attempt to delete information in respect of a request already made.” (The former is legal but not the latter.) The email dated 3/12/2008 included “a clear statement that e-mails had been deleted […] It seems likely that many of these ‘deleted’ e-mails subsequently became public following the unauthorized release from the backup server.” [10.5]
The Review found that the IPCM “may have lacked […] the authority to challenge the assertions of senior professors” and “the UEA senior staff need to take more explicit responsibility for these processes”. He told the Review he felt “very much the bull’s eye at the centre of the target”. He explicitly denied that he “became very supportive” as suggested by Jones. The 10/12/2008 email provides “evidence that the IPCM did try to warn Prof. Jones about deliberate deletion of information”. [10.5]
In general, “[t]he Review found an ethos of minimal compliance (and at times non-compliance) by the CRU with both the letter and the spirit of the FoIA and EIR. We believe that this must change”. The Review also made it clear that CRU did not receive enough support from UEA management, and made recommendations to the university on how it should handle future information requests. It also recommended to the ICO that it engage more with universities and clarify how FoI law applies to research.
However, as Steve Easterbrook commented, the Review “never really acknowledges the problems a small research unit (varying between 3.5 to 5 FTE staff over the last decade) would have in finding the resources and funding to be an early adopter in open data and public communication, while somehow managing to do cutting edge research in its area of expertise too.” The Review does point out that in the years since CRU was founded climate science has developed from “a relatively obscure area of science […] into an area of great political and public concern.”
The Review concluded:
[W]e find that a fundamental lack of engagement by the CRU team with their obligations under FoIA/EIR, both prior to 2005 and subsequently, led to an overly defensive approach that set the stage for the subsequent mass of FoIA/EIR requests in July and August 2009. We recognize that there was deep suspicion within CRU, as to the motives of those making detailed requests. Nevertheless, the requirements of the legislation for release of information are clear and early action would likely have prevented much subsequent grief. [10.6]
As Phil Jones has admitted, CRU did the wrong thing with regard to Freedom of Information requests. However, they clearly perceived that the requests were not being made in good faith. The Review apparently made no attempt to investigate the motivations of the requesters.
But all this must be considered in the context of the Review's general findings (summarised here): although the scientists failed to display the proper degree of openness, their rigour and honesty are not in doubt, and their behaviour did not prejudice the advice given to policymakers. Despite being heralded as “the final nail in the coffin of anthropogenic global warming”, Climategate has not even invalidated CRU's results, let alone the conclusions of the climate science community. In any case, the entire work of CRU comprises only a small part of the large body of evidence for anthropogenic global warming. That mountain of evidence cannot be explained away by the behaviour of a few individuals."
And please do not argue in this thread! That is not the purpose of it!
Källa:
http://www.skepticalscience.com/
Autentiska liv till salu.


